
Overview
The New Relic is a must-have tool when it comes to tuning and monitoring your java web application. The plugin is trivial to install on your application server and once your application is deployed and your app server restarted to take effect, you will quickly have access to a very informative dashboard (see Figure 1). Although the New Relic allows you to monitor different stacks – Servers, Applications, Transactions and Real-time user experience monitoring, while all the stacks are equally important, we’ll be focusing on the Application stack. I will also briefly explain the Transactions stack as this is a new feature that fits well for our tuning purpose.
Application Stack - Dashboard view
The Applications stack in the dashboard displays the applications that are deployed. On the right hand side recent events are displayed. These are important as they list out Alert notifications which are based on customizable parameters, Apdex score which is based on application’s throughput and is also customizable, Critical problems such as Error rate, Downtime and any recent activities performed on the dashboard such as updating application settings. Clicking on any of these notifications will allow you to drill down to view detailed, graphical reports. We should now click on the application name (OPD) in order to set performance monitoring parameters and analyze them.
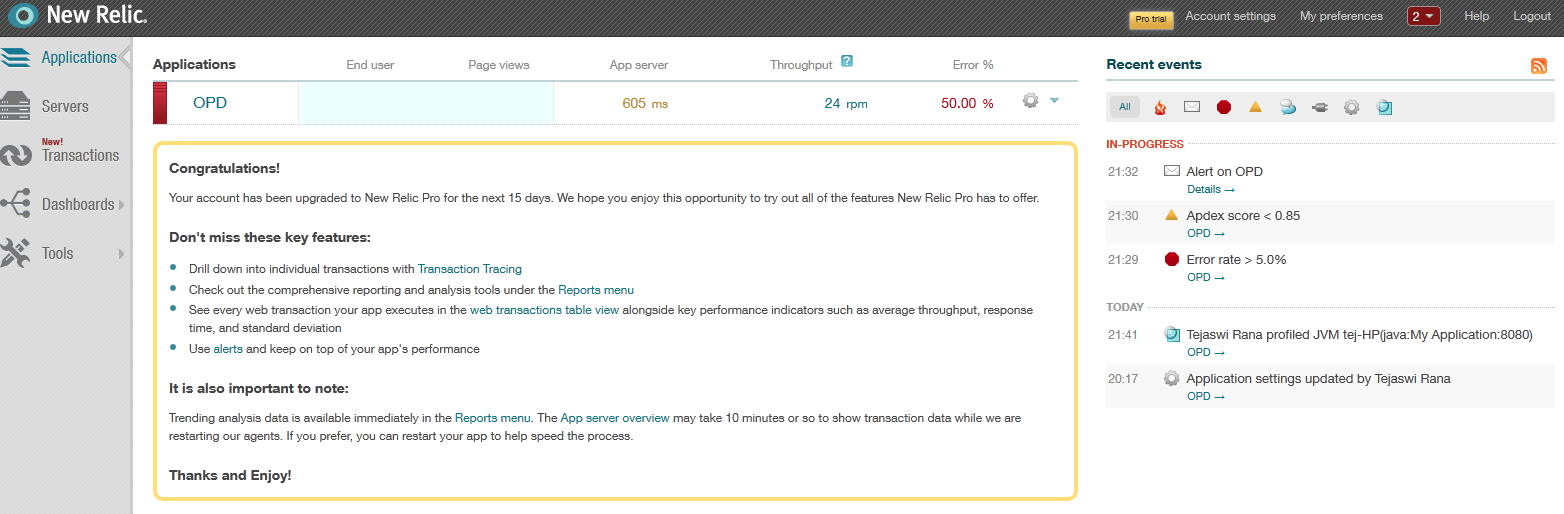
Figure 1: Dashboard View of Sample Web Application – OPD
Tuning the Application
All of our work for this tutorial is managed under the Monitoring tab. The 5 steps we will be focusing on are –
i. Database operations – operations that are most time consuming.
ii. Web transactions – APDEX most dissatisfying.
iii. Profiling JVM – CPU burn broken down by web requests.
iv. External Services - Total Response time of external services.
v. Transactions – Closely monitor ‘key’ web transactions with more precision.
Please note that I have selected only one of the many tuning parameters available on each of the tuning steps. The last step is found under the Transactions stack.
Database Operations – operations that are most time consuming
Probably, the most important area of tuning a web application apart from the code itself is the database. Here we want to look at database operations (Select, Update, Insert, Delete) that are most time consuming. Figure 2 below shows that ‘SELECT’ queries against table ‘patient_detail’ are being made 45% of the time. When we combine this information with the response time and throughput graph on the right, we will be able to flag this. In this instance, the throughput is less than 2ms. So we’re good. Additionally, we can also examine what pages/resources (jsps, filters, interceptors, etc.) are making this database call.
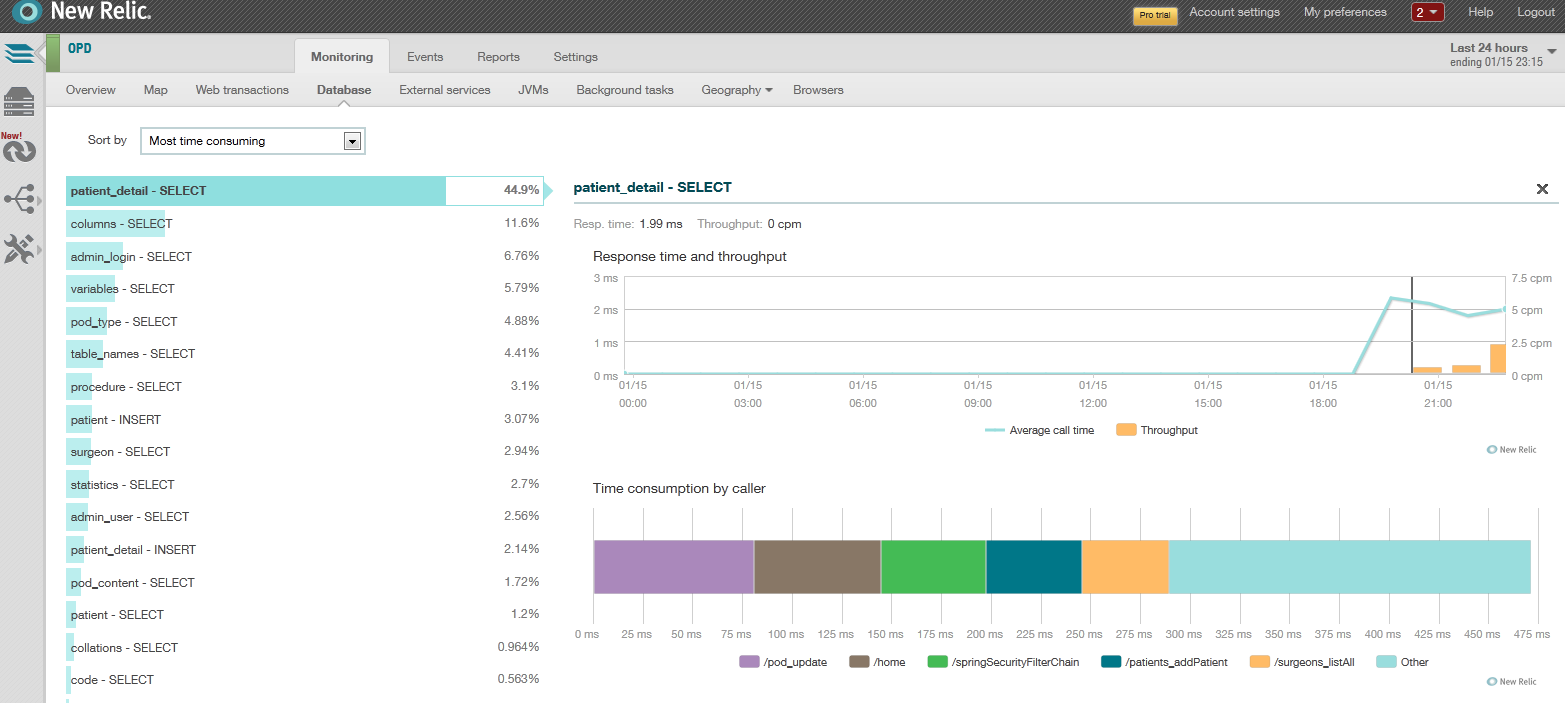
Figure 2: Database Operations sorted by ‘Most time consuming’ filter
Web transactions – APDEX most dissatisfying transactions
APDEX or Application Performance Index takes into account averages of response times of each transaction and gives insight about user satisfaction. This is useful in determining what web transactions are taking exponentially longer than others and resulting in user dissatisfaction. Figure 3 shows that ‘/login’ needs to be looked into immediately as it is consuming 88% of the overall wall clock time. At the bottom right we can see ‘App server transaction traces’ that show two separate instances of request made to ‘/login’ took over 6.5 seconds.

Figure 3: APDEX ‘Most dissatisfying’ web transactions
Profiling JVM – CPU burn broken down by web requests
We can also profile the JVM to look at CPU burn broken down by web requests to view what requests are hogging the CPU. We can then look at that specific part of the code to further examine. Figure 4 displays a sample profile output. There isn’t request that is really hogging the CPU. So we’re good here.

Figure 4: JVM Profiling for CPU burn filtered by Web Requests
External Services - Total Response time of external services
If we have any REST or WS* web service calls or remote messaging, we can view the response times of those external services to see if any of the calls are taking longer than our specified APDEX. To an end user these external services should feel like making a request to any other web transaction. Although our sample application does not make any external service calls, you can easily view these from the ‘External services’ sub tab under the ‘Monitoring’ tab.
Transactions – Closely monitor ‘key’ web transactions with more precision
The new ‘Transactions’ stack allows monitoring of the most important assets of the application. Under the hood this is similar to identifying slow response time for a web transaction. The added benefit of using this is we can view more detailed graph with all the resources associated with the transaction. For example, I’ve created a ‘Security Check’ transaction to monitor the authentication and authorization process of spring security framework. In figure 5, we can see response times of different filters in the filter chain. Notice also the error rate is very high at around 11:45am till noon. We can view the application server’s log for that period of time to see what is going on.

Figure 5: Key Transactions
Summary
All of the steps we took in improving our java application’s performance are only fraction of what we can do with New Relic. Also, the application could easily have been an asp.net application. We can also monitor the server stack in addition to the application stack to get a better picture of how our application(s) make use of the server resources such as I/O, RAM and CPU.